Lazy Bookworm
Diagram, Data Visualization
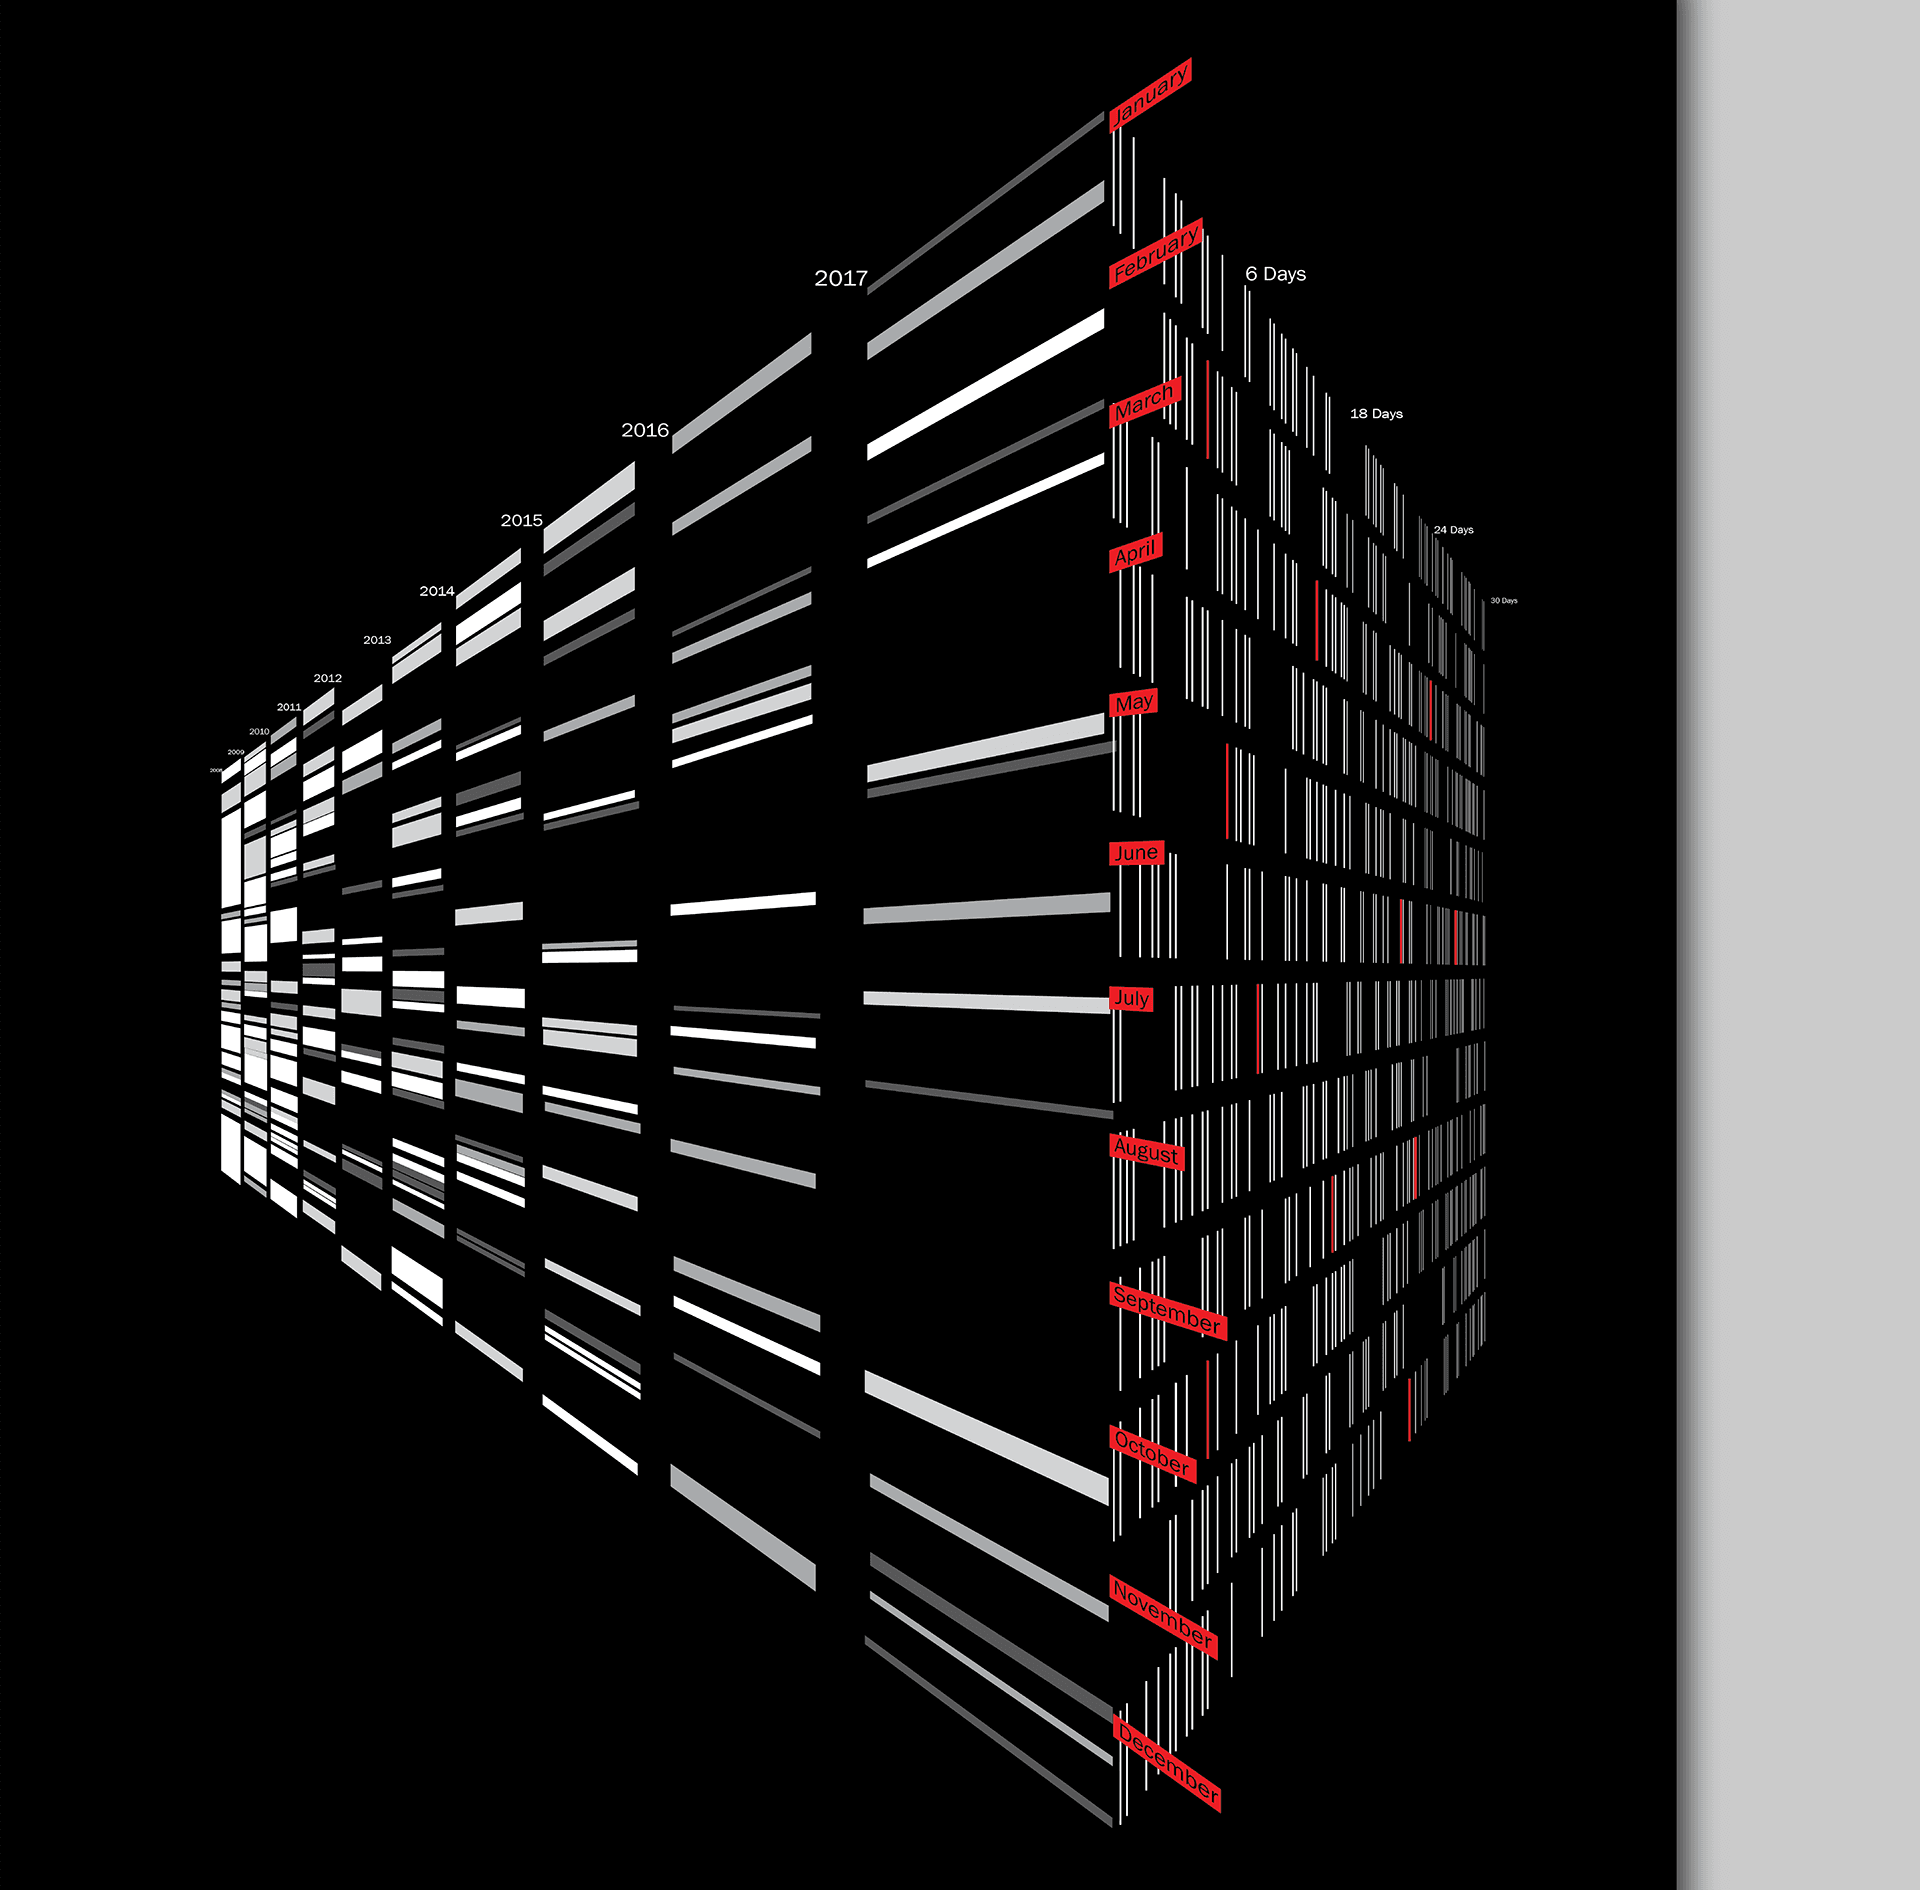
This biodiagram reveals the situation of my reading schedule in the busy modern life. The willingness to read looks like an avalanche but the act of reading feels like reeling silk. I combined the information of the two tables into the form of a bookshelf. In the table on the left, in white with different brightness levels, I display the number and types of books I have read in recent years. On the right, I have marked the books that I would like to read every month.


